I'll be starting some GIS work here on Hawaii soon but in the meantime I've been assisting the geologists in the field. This has been a great help is getting to know the lay of the land and the basics of Hawaiian geology.
I took my first ever chopper ride up to near the caldera of Mauna Loa. Here we sampled from several plots to weigh lithics and pyroclastic material ejected during previous eruptions. We were at approx 4000 meters and the work was tough going at such high altitudes.
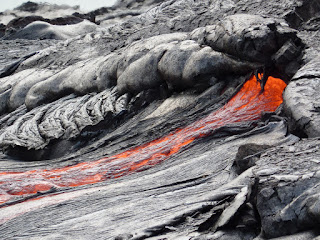
A couple of days later we undertook a gruelling trek across old lava to reach the hot new stuff. It was well worth the toil as I saw lava for the first time. We witnessed a few breakouts from the lava tubes as the lava made its way to the Pacific Ocean from the East Rift Zone. A huge plume is formed where the hot lava meets the cool ocean.
After giving oursleves a day to recover we then trecked out to the Pali (Hawaiian for cliff) to retrieve GPS receivers. These receivers are far larger and more accurate than the average hand held devices that most people are used to. They are accurate to within 1 cm. The receivers are used to measure any movement of material. The old lava is slowly spreading from the Pali towards the ocean but 'rapid' movements can occur due to seismic and volcanic events.
images courtesy of USGS
Thursday, 26 November 2009
Wednesday, 21 October 2009
The Big Island
Aloha! I still can't quite believe it, but I've landed a job at the Hawaiian Volcano Observatory. I will be modelling the topography of lava flow inundation paths and also looking at ashfall zones and volcanic plumes. The observatory is located on Hawai'i (The Big Island), right by the caldera of Kilauea, the most active volcano on the planet. I'm hoping to be out there for 3 - 6 months.
Wednesday, 7 October 2009
Finalmente!
At last my masters is over! I'm now going to be leaving my job at Foster + Partners to do some voluntary work abroad (more to follow). I've included the final habitat suitability map for the Magellanic woodpecker. Please see the separate website for more details.
Thursday, 27 August 2009
Campephilus-GIS
Only a month to go till my dissertation deadline! I have created a website for discussing the different environmental factors that affect habitat suitability for the Magellanic Woodpecker on Tierra del Fuego.
The main aim of the website is to get expert feedback on these factors so the model can be justified.
Thursday, 30 July 2009
Fuzzy Feelings
ahhh it's nice to be using Idrisi again. When it comes to multi-criteria analysis its far superior to ArcGIS. Idrisi has a handy tool called Fuzzy which allows you to use fuzzy logic to create countinuous boundaries around (in my case) roads and rivers. For my project I was thinking of creating a 5km buffer around roads as the Magellanic woodpecker prefers undisturbed environments but buffers aren't very clever. The buffer approach would assume that being 1cm from the road is the same as being 4.9 km from the road. The fuzzy tool in Idrisi allows me to create a rule based on a membership function stating for example that you will definitely not find a woodpecker within 100m of the road and that your chances would increase up to 5km after which the road would have no effect at all. I will also apply fuzzy logic to distance from rivers and elevation. The images below shows the buffer and fuzzy approach applied to the road network. Click for detail.
The image below shows the Idrisi Distance tool applied to the river network of the study area. Each pixel is assigned the value of its distance to the nearest river in metres.
Thursday, 2 July 2009
Enter The Beaver
The woodpecker project is now fully underway! I've been collecting data on vegetation, hydrology, roads etc as well as getting hold of a good DEM of the study area. The main factor determining habitat suitability is undoubtedly vegetation type. Woodpeckers are only found in native mature lenga (beech) forests. Which areas of these forests are more suitable is likely to be dependent on proximity to beaver colonies. The dams created by the beavers produce localised flooding which results in more rotten trees which suit woodpecker nesting.
The American Beaver (Castor canadensis) was introduced to Tierra del Fuego in 1946 and is thought to have reached its full abundance potential along the river systems. Although 8.5% of the Island’s Beech forest have been destroyed by beaver activity the swampland they create is favoured by the woodpeckers due to increased fungal action on trees facilitating nesting.
I should be getting some more data on beaver colonies from the Wildlife Conservation Society. The coverage is unlikely to be complete for my area of study so I will have to look at ways of identifying sections of river likely to contain beaver colonies.
Friday, 19 June 2009
Starlogo Deforestation model
Along with fellow students Ian Tout and Christoph Massius I created a geocomputation deforestation model using starlogo. The aim of the project was to model selective mahogany logging in rainforest regions. The model is an incredibly simplified view of reality but was a useful excercise in gaining an understanding of agent-based modelling.
In this model the agents are logging teams moving randomly through the forest until they come across a mahagony tree. When this occurs the mahagony tree is logged and a path is created back to the existing network of paths using a choice of two shortest-path algorithms.
The number of logging teams, mahogany trees and logger energy is set at the start of the model runtime. Logger energy controls how long a logging team will search beyond the existing path network before giving up.
The starlogo file can be found here
http://sites.google.com/site/geohughesweb/Home/starlogo-deforestation
and starlogo can be downloaded here
Thursday, 7 May 2009
Landslide Susceptibility Modelling
Monday, 16 March 2009
London Rio Light Bridge
I helped out my friend Silv with her project to create a light bridge from London to Rio. This involved taking a simultaneous photo in Rio and in London at the correct bearing so the two lenses are facing each other though of course out of direct view. The photo for London was in fact taken on the coast at Selesy in Sussex which lies on the bearing from London to Rio
Once you know the latitude and longtitude of the two locations the bearing can easily be found using the this website
Wednesday, 4 March 2009
Karukinka Dreaming.....
If all goes well I will be doing my dissertation on creating habitat suitability maps for the Magellanic Woodpekcer in Karukinka National park, Patagonia. This species of woodpeck is endangered and is a bioindicator for non-disturbed enviroments due to its sensitivity. It is also a keystone species for the Patagonian ecosystem.
The aim of the project is to use remotely sensed satellite data along with other environmental variables to create habitat suitability maps for the species. This will indicate areas where the woodpecker is likely to be found so field ecologists can save resources searching vast areas for species presence.
Severn Estuary
Just messing about posting my first post. This is a color composite image I created using Idrisi from Landsat satellite data. Its of the Severn Estuary.
Subscribe to:
Posts (Atom)